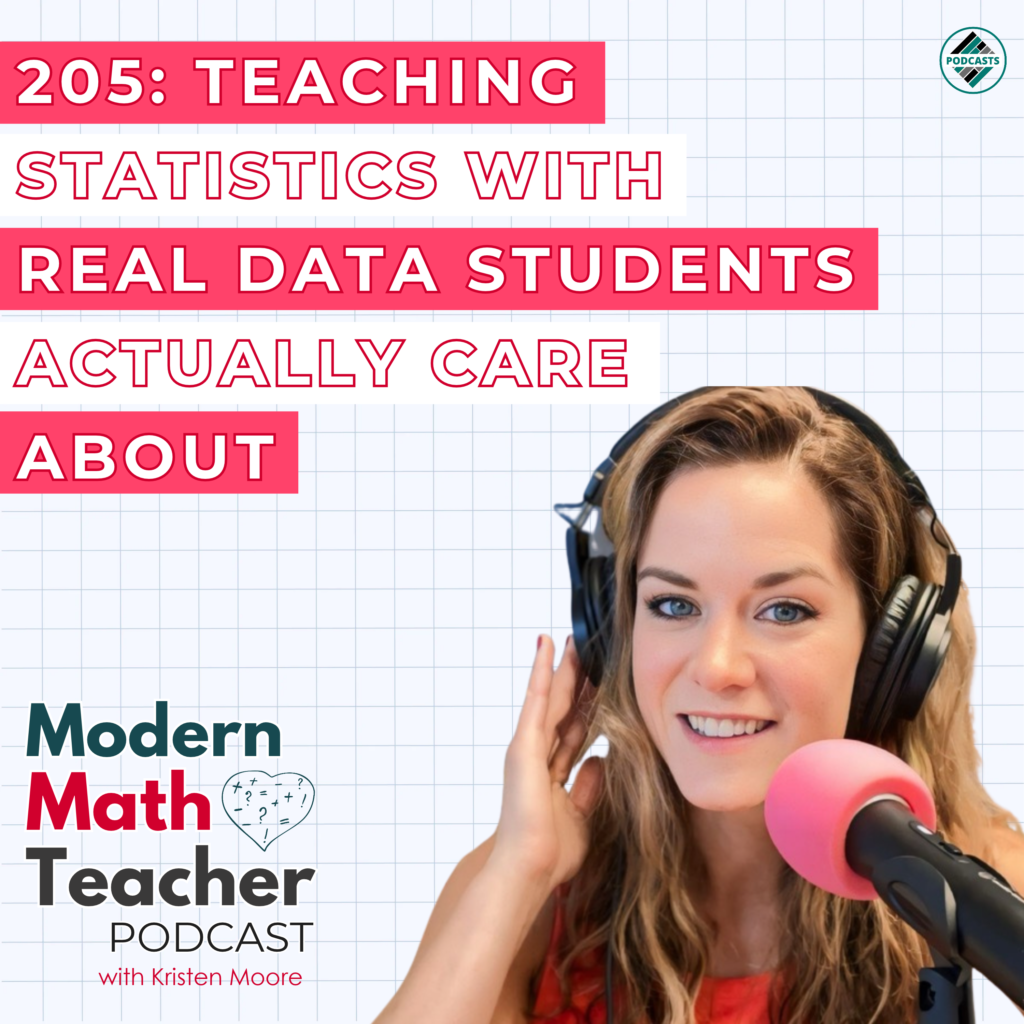
Statistics is one of the easiest places to make math meaningful. Our students are already surrounded by data. They see sports statistics, social media analytics, rankings, polls, percentages, weather predictions, and graphs in the news. Numbers are constantly being used to explain what’s happening in the world around them.
But sometimes, when students walk into math class, we hand them a list of numbers and ask them to find the mean.
And listen, students absolutely need to know how to calculate the mean, median, interquartile range, and standard deviation. They need to know how to create dot plots, histograms, box plots, and scatter plots.
The question is whether we’re giving them opportunities to use those skills to understand something.
Teaching statistics isn’t just about helping students calculate numbers. It’s about helping them think with data.
Move Beyond Calculating Data
There’s nothing wrong with teaching students how to calculate a statistic or create a graph. Those skills are essential. But the calculation or representation is supposed to help us understand something.
That’s where I think statistics instruction can become much more meaningful.
Instead of stopping when students calculate the mean, ask what that number tells them about the data. Instead of having students create a box plot simply because it’s the focus of the day’s lesson, give them a reason to use one.
What might a box plot help them notice about two groups? Is there an outlier? How does that outlier affect the data? What happens when they compare the measures of center and spread?
When students work with scatter plots, they can investigate whether two variables appear to be related. They can consider whether a line of best fit is useful and whether the relationship could help them make a prediction.
These questions don’t replace the mathematical skills students need to learn. They give those skills a purpose.
The goal isn’t to stop calculating. It’s to help students understand what their calculations mean and how they can use them to answer questions.
Our Students Are Already Being Asked to Interpret Data
Think about the information students encounter every day.
They see percentages attached to social media trends, statistics used to compare athletes, polls predicting election outcomes, and graphs supporting claims in news stories. They may not always recognize the mathematics behind that information, but they’re constantly being asked to interpret it.
That makes statistics an important opportunity to develop mathematical literacy.
Consider election data. Students might encounter voter turnout percentages, polling results, demographic comparisons, and graphs showing changes over time. These are opportunities to explore how data is collected, represented, interpreted, and used to support claims.
My goal isn’t to use math class to tell students what to think politically. It’s to help them think mathematically about the information they encounter.
What is being measured? Who is represented in the data? Which variables are being compared? Does the graph show a clear pattern? Is that pattern strong enough to support a prediction? Does the conclusion someone is making actually follow from the evidence?
Those are mathematical questions, and students need opportunities to practice answering them.
They also need to recognize when a claim goes beyond what the data can reasonably support.
Mathematical literacy means knowing how to work with data, but it also means knowing how to question it.
Give Students Something to Investigate
One way to make statistics more meaningful is to organize learning around an investigation rather than a collection of disconnected problems.
Instead of giving students a set of numbers and telling them which calculation to perform, start with something worth understanding.
What can we learn from this data? How do two groups compare? Is there a relationship between these variables? What patterns emerge when we represent the information in different ways?
These questions give students a reason to choose and use statistical tools.
That’s the idea behind my Election Data + Statistics Project.
Designed for middle and high school math, the project gives students an opportunity to work with election-related data while practicing and applying statistical concepts.
Students organize and represent data, examine measures of center and spread, explore relationships between variables, work with statistical representations, and make predictions.
The important part is that the mathematics isn’t sitting separately from the context. Students use the mathematics to investigate the data.
That changes the questions they’re answering.
Instead of simply asking students to create a box plot, we can ask what the box plot helps them understand about the data. Instead of asking them to find a line of best fit, we can ask whether the relationship between two variables could help them make a reasonable prediction.
The procedure still matters. Students need to understand how to create and interpret these representations. But now they have a reason to think about which tools are useful and what those tools help them see.
That’s the shift from completing statistics problems to investigating with statistics.
Real Data Doesn’t Always Behave Nicely
One of my favorite things about using authentic data is that it doesn’t always produce the neat, predictable results we see in textbook examples.
The patterns might not be obvious. There may be outliers. Two groups might look similar in one representation but different in another. A relationship between variables might exist without explaining why those variables are related.
I think those situations can lead to some of the richest mathematical discussions.
When every problem has a clear path to one expected answer, students can become focused on figuring out which procedure the teacher wants them to use. When the data is more complex, they have to pay closer attention to what they’re seeing.
They might need to compare representations, explain why they chose a particular measure, or reconsider an initial conclusion after noticing an outlier.
They have to make sense of the information rather than simply follow a set of steps.
Of course, authentic data still needs to be appropriate for the students and the mathematical goals of the lesson. Real data isn’t automatically better just because it comes from the real world.
The key is choosing data that gives students a worthwhile question to investigate and an opportunity to use the mathematics they’re learning.
Teach Students to Ask, “What Does the Data NOT Tell Me?”
If there’s one question I want students to get comfortable asking, it’s this:
What does the data NOT tell me?
A graph might show a relationship between two variables, but that doesn’t automatically mean one caused the other.
A statistic might describe a particular group, but that doesn’t mean it accurately represents everyone.
A model might produce a reasonable prediction, but that doesn’t make the prediction guaranteed.
And a graph can look convincing while leaving out information that would change how someone interprets it.
Students need to understand these limitations.
When we teach statistics, I want students to become thoughtful consumers of information. I want them to pause when they see a claim supported by numbers and ask where those numbers came from, what was measured, who was included, and whether the conclusion is reasonable.
That kind of skepticism isn’t about assuming every statistic is wrong. It’s about learning to evaluate evidence before accepting a claim.
And that skill matters well beyond the math classroom.
This Doesn’t Have to Be Election Data
Election data is a timely example, but the bigger idea works across all kinds of contexts.
You could use sports statistics to compare player performance. Weather data could help students examine patterns and make predictions. Environmental data could give them opportunities to investigate changes over time. School or community data could help them explore questions connected to their own experiences.
The possibilities are broad, but you don’t need to find the most exciting data set on the internet to get started.
Start with the mathematics you’re teaching and think about what students could investigate with it.
If you’re working on measures of center and spread, what groups or distributions could students compare? If you’re teaching scatter plots and linear models, what variables might be worth investigating? If students are learning about data displays, what question could different representations help them answer?
The context should support the mathematical goal, not distract from it.
And not every statistics lesson needs to become a full project. Students still need direct instruction, focused practice, and opportunities to build foundational skills. The goal is to balance those experiences with opportunities to apply the mathematics in meaningful ways.
Sometimes a short investigation is enough to help students see why a statistical tool matters.
You Don’t Have to Build the Investigation From Scratch
If you’re teaching statistics soon and want to give students an opportunity to work with election-related data, I’ve already put together a resource you can use.
My Election Data + Statistics Project is available in my Teachers Pay Teachers store. It brings together real election-related data and statistical concepts in an investigation designed for middle and high school math.
You can use it when it fits your curriculum, adapt it to your students, or use the idea as inspiration for an investigation of your own.
The important thing is that students get opportunities to do more than calculate statistics. They need chances to interpret what those statistics mean, ask questions about the data, and evaluate the conclusions people draw from it.
Because our students are already growing up in a world full of numbers, graphs, and claims supported by data.
Let’s make sure they’re prepared to make sense of it.
Are Your Students Learning to Think With Statistics?
As you plan your next statistics lesson, consider one question:
Are my students only learning how to calculate statistics, or are they also learning how to think with them?
Ideally, we’re giving them opportunities to do both.
The calculations and representations matter. So does the thinking that happens when students use those tools to investigate something, interpret evidence, and decide what conclusions the data can actually support.
When we give statistics a meaningful purpose, students have a better opportunity to see mathematics as something they can use to understand the world around them.
Until next time, keep it real.
 Listen & Connect
 Listen to the episode: https://www.buzzsprout.com/2187419/episodes/19979768
 Instagram: @moorethanjustx
 Join the free FB group: The Modern Math Teacher Community
 Become a Modern Math Teacher Member
 Explore more resources: www.moorethanjustx.com