Wondering how to get your students graphic functions?
It can be such a struggle.
You hand out the graphing assignment, and within seconds, hands shoot up.
“Wait, which one is x again?”
“Do we start at the top or bottom?”
“This looks nothing like yours!”
…sound familiar?
Graphing functions can feel like a puzzle with missing pieces for many students.
They struggle to connect tables, equations, and graphs, and if they plot a few wrong points, they’re convinced the whole thing is broken.
Once students see the patterns, graphing starts to make sense – and even feel predictable.
The key is building confidence through structure, hands-on activities, and plenty of practice.
In this post, we’ll break down how to help students master graphing functions – without the frustration.
Just looking for a resource to help your students with graphing functions?
➡️ Click here to learn more about my graphing functions project. Your students will love it!
About Kristen and Moore Than X
I’m a high school math teacher who’s passionate about project-based learning, and making math relevant for students.
You can learn more about me and Moore Than X here.
Plotting Points: The First Step to Graphing
Before students can graph functions with confidence, they need to understand why graphing matters.
We need to help them see that every graph tells a story of how different values relate to each other.
Whether they’re tracking the speed of a car, predicting profits in a business, or modeling population growth graphs show what words can’t.
Understanding Domain and Range
One of the biggest hurdles students face when graphing functions is knowing which points make sense to plot.
That’s where domain and range come in:
- Domain – The set of all possible input values (x-values).
- Range – The set of all possible output values (y-values).
A simple way to explain it: If a function were a vending machine, the domain would be all the buttons you could press (the inputs), and the range would be all the snacks that could come out (the outputs).
💡 Tip: Start with real-world examples like:
- The domain of a school day (time from first bell to last bell).
- The range of temperatures over a week.
- The domain of possible shoe sizes vs. the range of actual sizes available in a store.
Step-by-Step: How to Plot a Function
Once students understand domain and range, they’re ready to start plotting!
Here’s a simple, structured approach to help them succeed:
1️⃣ Set Up the Axes – Review the coordinate plane. Label the x-axis (horizontal) and y-axis (vertical). Discuss how positive and negative numbers fit into the four quadrants.
2️⃣ Create a Table of Values – Have students substitute x-values into a function and calculate corresponding y-values. This helps reinforce function notation and gives them a roadmap for their graph.
3️⃣ Plot the Points – Teach students to carefully count spaces and mark points. Color-coding positive vs. negative values can be a helpful visual cue.
4️⃣ Connect the Points – Once all points are plotted, students can connect them to reveal the function’s shape. This is where they start to see patterns and relationships.
Common Student Mistakes and Fixes
- 🚨 Mixing up x and y: Teach them to always write coordinates as (x, y) and double-check before plotting.
- 🚨 Forgetting negative signs: Have them highlight negatives in their tables before they start graphing.
- 🚨 Not scaling the graph properly: If their graph looks cramped or uneven, they may need to adjust the scale on their axes.
By helping students see why graphing functions is important – and giving them a clear, structured way to do it – you’ll set them up for success before they ever pick up a ruler.

Identifying and Graphing Different Types of Functions
Once students understand how to plot points, the next step is recognizing patterns in different types of functions.
Functions follow specific rules that create lines, curves, and unique shapes.
By helping students identify these patterns early on, you make graphing feel less like guesswork and more like a predictable process.
Linear Functions: The Foundation of Graphing
What it looks like: A straight line
Equation format: (Slope-Intercept Form)
Key features of Linear Functions:
- ✔ Constant rate of change (slope)
- ✔ The y-intercept (b) tells where the line crosses the y-axis
- ✔ Always increasing, decreasing, or staying constant
📌 Teaching Tip: Have students graph multiple linear equations on the same coordinate plane and compare slopes. This helps them see how different slopes affect steepness and direction.
Quadratic Functions: Understanding Parabolas
What it looks like: A U-shaped curve (parabola)
Equation format: y=ax²+bx+c
Key features of Quadratic Functions:
- ✔ Can open up (a>0) or down (a<0)
- ✔ Has a vertex (highest or lowest point)
- ✔ Symmetrical
📌 Real-World Example: Projectile motion—like throwing a ball—follows a quadratic path. Try using a Desmos simulation to show how changing the equation affects the parabola’s shape.
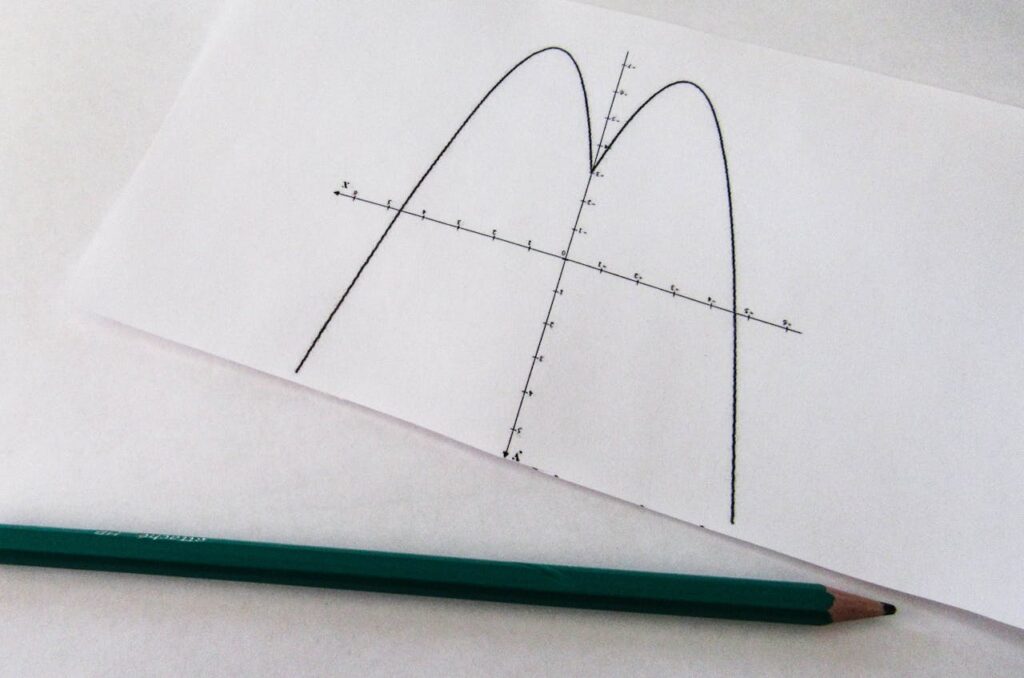
Absolute Value Functions: The V-Shape
What it looks like: A V-shaped graph
Equation format: or y=a∣x−h∣+k
Key features of Absolute Value Functions:
- ✔ Symmetrical with a sharp “V” vertex
- ✔ The steepness changes based on the coefficient of x
- ✔ No negative outputs unless shifted
📌 Activity Idea: Give students a graph of an absolute value function but remove the equation—then challenge them to figure out what the equation might be based on the graph’s transformations!
Exponential Functions: Growth and Decay
What it looks like: A rapidly increasing or decreasing curve
Equation format:
Key features of Exponential Functions:
- ✔ Growth when b>1, decay when 0<b<1
- ✔ The rate of change increases or decreases exponentially
- ✔ Never touches the x-axis (asymptote)
📌 Real-World Example: Bacteria growth, population trends, or interest rates. Show students a real-life graph of exponential growth (like social media followers or a virus spread like in this project) to make it relevant.

Why a Project-Based Approach Works Best With These Skills
Graphing functions can feel dry when students are just plotting points on a worksheet.
Even when they start to see the patterns, they often don’t truly understand what the graph represents or why it matters.
That’s where project-based learning changes everything.
Instead of just following steps, students are actively creating, analyzing, and interpreting graphs in a way that connects math to real life.
When students work on a project, they:
- See the bigger picture – They’re not just connecting dots; they’re telling a story through a function.
- Make real-world connections – They see how graphs represent patterns in nature, business, and everyday life.
- Take ownership of their learning – Instead of just following formulas, they make choices, solve problems, and think critically.
- Retain information longer – When students experience graphing functions rather than just memorizing steps, they remember it.
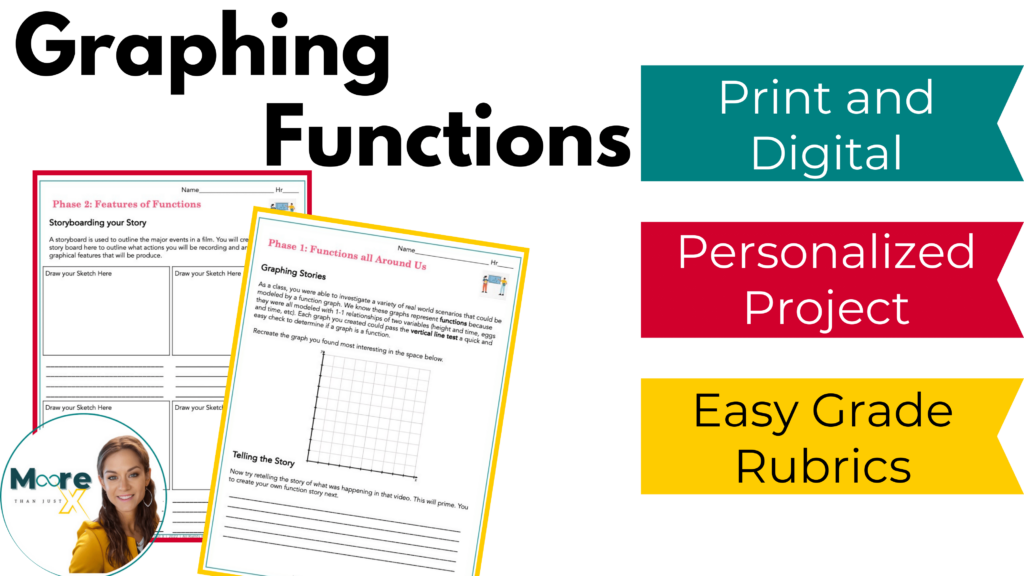
The Ultimate Hands-On Graphing Functions Project
If you want to give your students a meaningful, engaging way to practice graphing functions, then you need to have them do this graphic equations project.
This multi-day project goes beyond basic graphing by helping students:
- Graph and analyze real-world functions
- Identify key characteristics like domain, range, and intercepts
- Evaluate functions from a graph and describe their behavior
- Understand how graphs represent real-life situations
How It Works:
- Students start by exploring Graphing Stories to see how graphs tell a story.
- Then, they create their own function-based story, graphing key events as a function.
- Finally, they analyze their graphs, identifying function characteristics like increasing/decreasing intervals, max/min values, and intercepts.
By the end of this project, your students aren’t just plotting points – they’re thinking like mathematicians, interpreting functions with confidence, and building a real connection to the math.
💡 Bonus Tip: Keep student exemplars from this project to show future students different examples of function graphs in action!